

Shiba Inu continues to make the statement of being more than just a meme coin with recent and upcoming developments, unlike Dogecoin and many other dog-inspired meme cryptocurrencies. Since the start of 2023, SHIB has been one of the best-performing cryptocurrencies.
Shibarium Brightens Shiba Inu (SHIB) Fundamentals
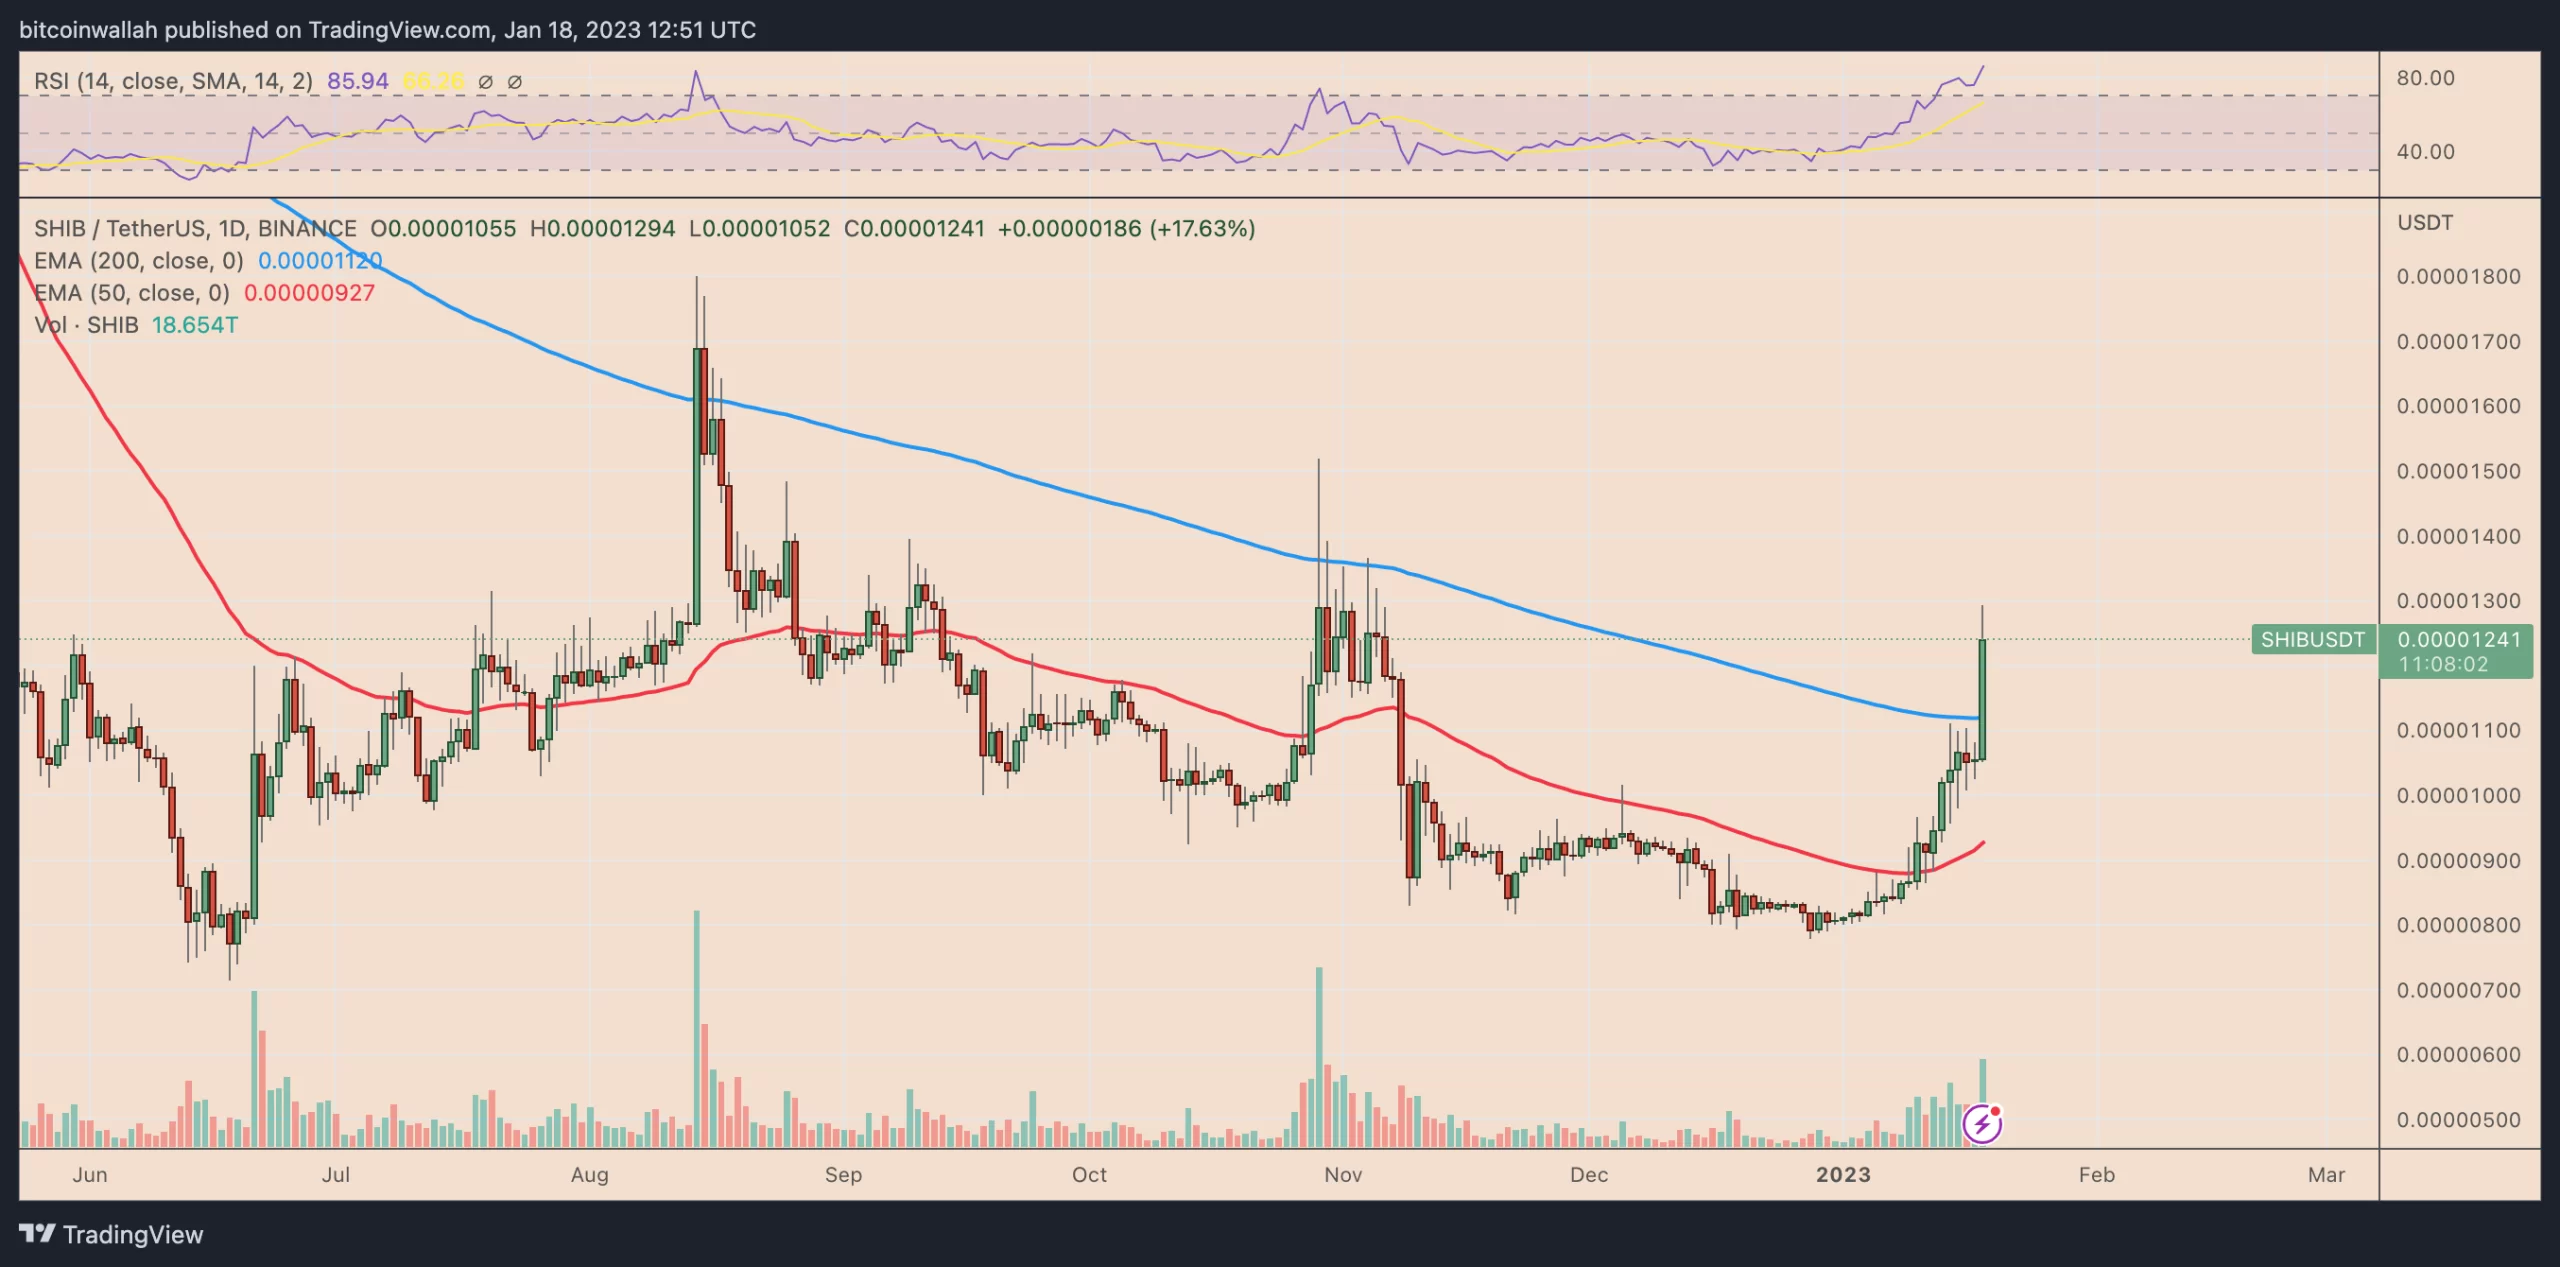
SHIB’s price has rallied nearly 60% year-to-date (YTD) to $0.00001294, its highest since early November 2022.
The gains started appearing mainly due to favorable macro conditions that prompted similar rallies elsewhere in the crypto market. Additionally, the Shiba Inu price rally picked up momentum as investors assessed its announcement of the upcoming beta release of Shibarium.
Shibarium is reportedly a layer-2 network that would run atop the Ethereum blockchain mainnet. In other words, it would enable developers to build and launch decentralized applications (dapps) while aiming for lower transactional costs and improved network scalability.
Shiba Inu price is now up 25% since Jan. 16 when the Shiba Inu team teased the community members with the Shibarium launch announcement.
🍖 Introduction to Shibarium: Shiba Inu’s Layer 2 Network — Rejoice #ShibArmy! Shibarium Beta is about to be launched, and through this article we want to introduce some basic concepts in order to provide clarity to the community.
Read more: https://t.co/xWyPaVlQQ4
— Shib (@Shibtoken) January 15, 2023
Is Shiba Inu (SHIB) Ready for another 75% Surge?
Shiba Inu’s rally has made it an excessively bought asset on a daily timeframe, according to its relative strength index (RSI) reading at almost 86 on Jan. 18 — sixteen points above the overbought threshold of 70.
Ideally, an overbought RSI prompts investors to unload their positions, leading to a price correction. In other words, SHIB risks dropping toward its 200-day exponential moving average (200-week EMA; the blue wave) near $0.00001120.
However, on a long-term basis, SHIB’s price rally is likely to continue, if the bullish reversal pattern on the weekly chart is to be believed.
Dubbed the “falling wedge,” the pattern develops when the price trends lower inside a range defined by two descending, converging trendlines.
It resolves after the price breaks above the upper trendline toward the level at a length equal to the wedge’s maximum height.
SHIB has entered the breakout stage of its falling wedge pattern, as shown below. It now sees an extended upside toward $0.00002063 by March 2023, up 35% from current price levels.
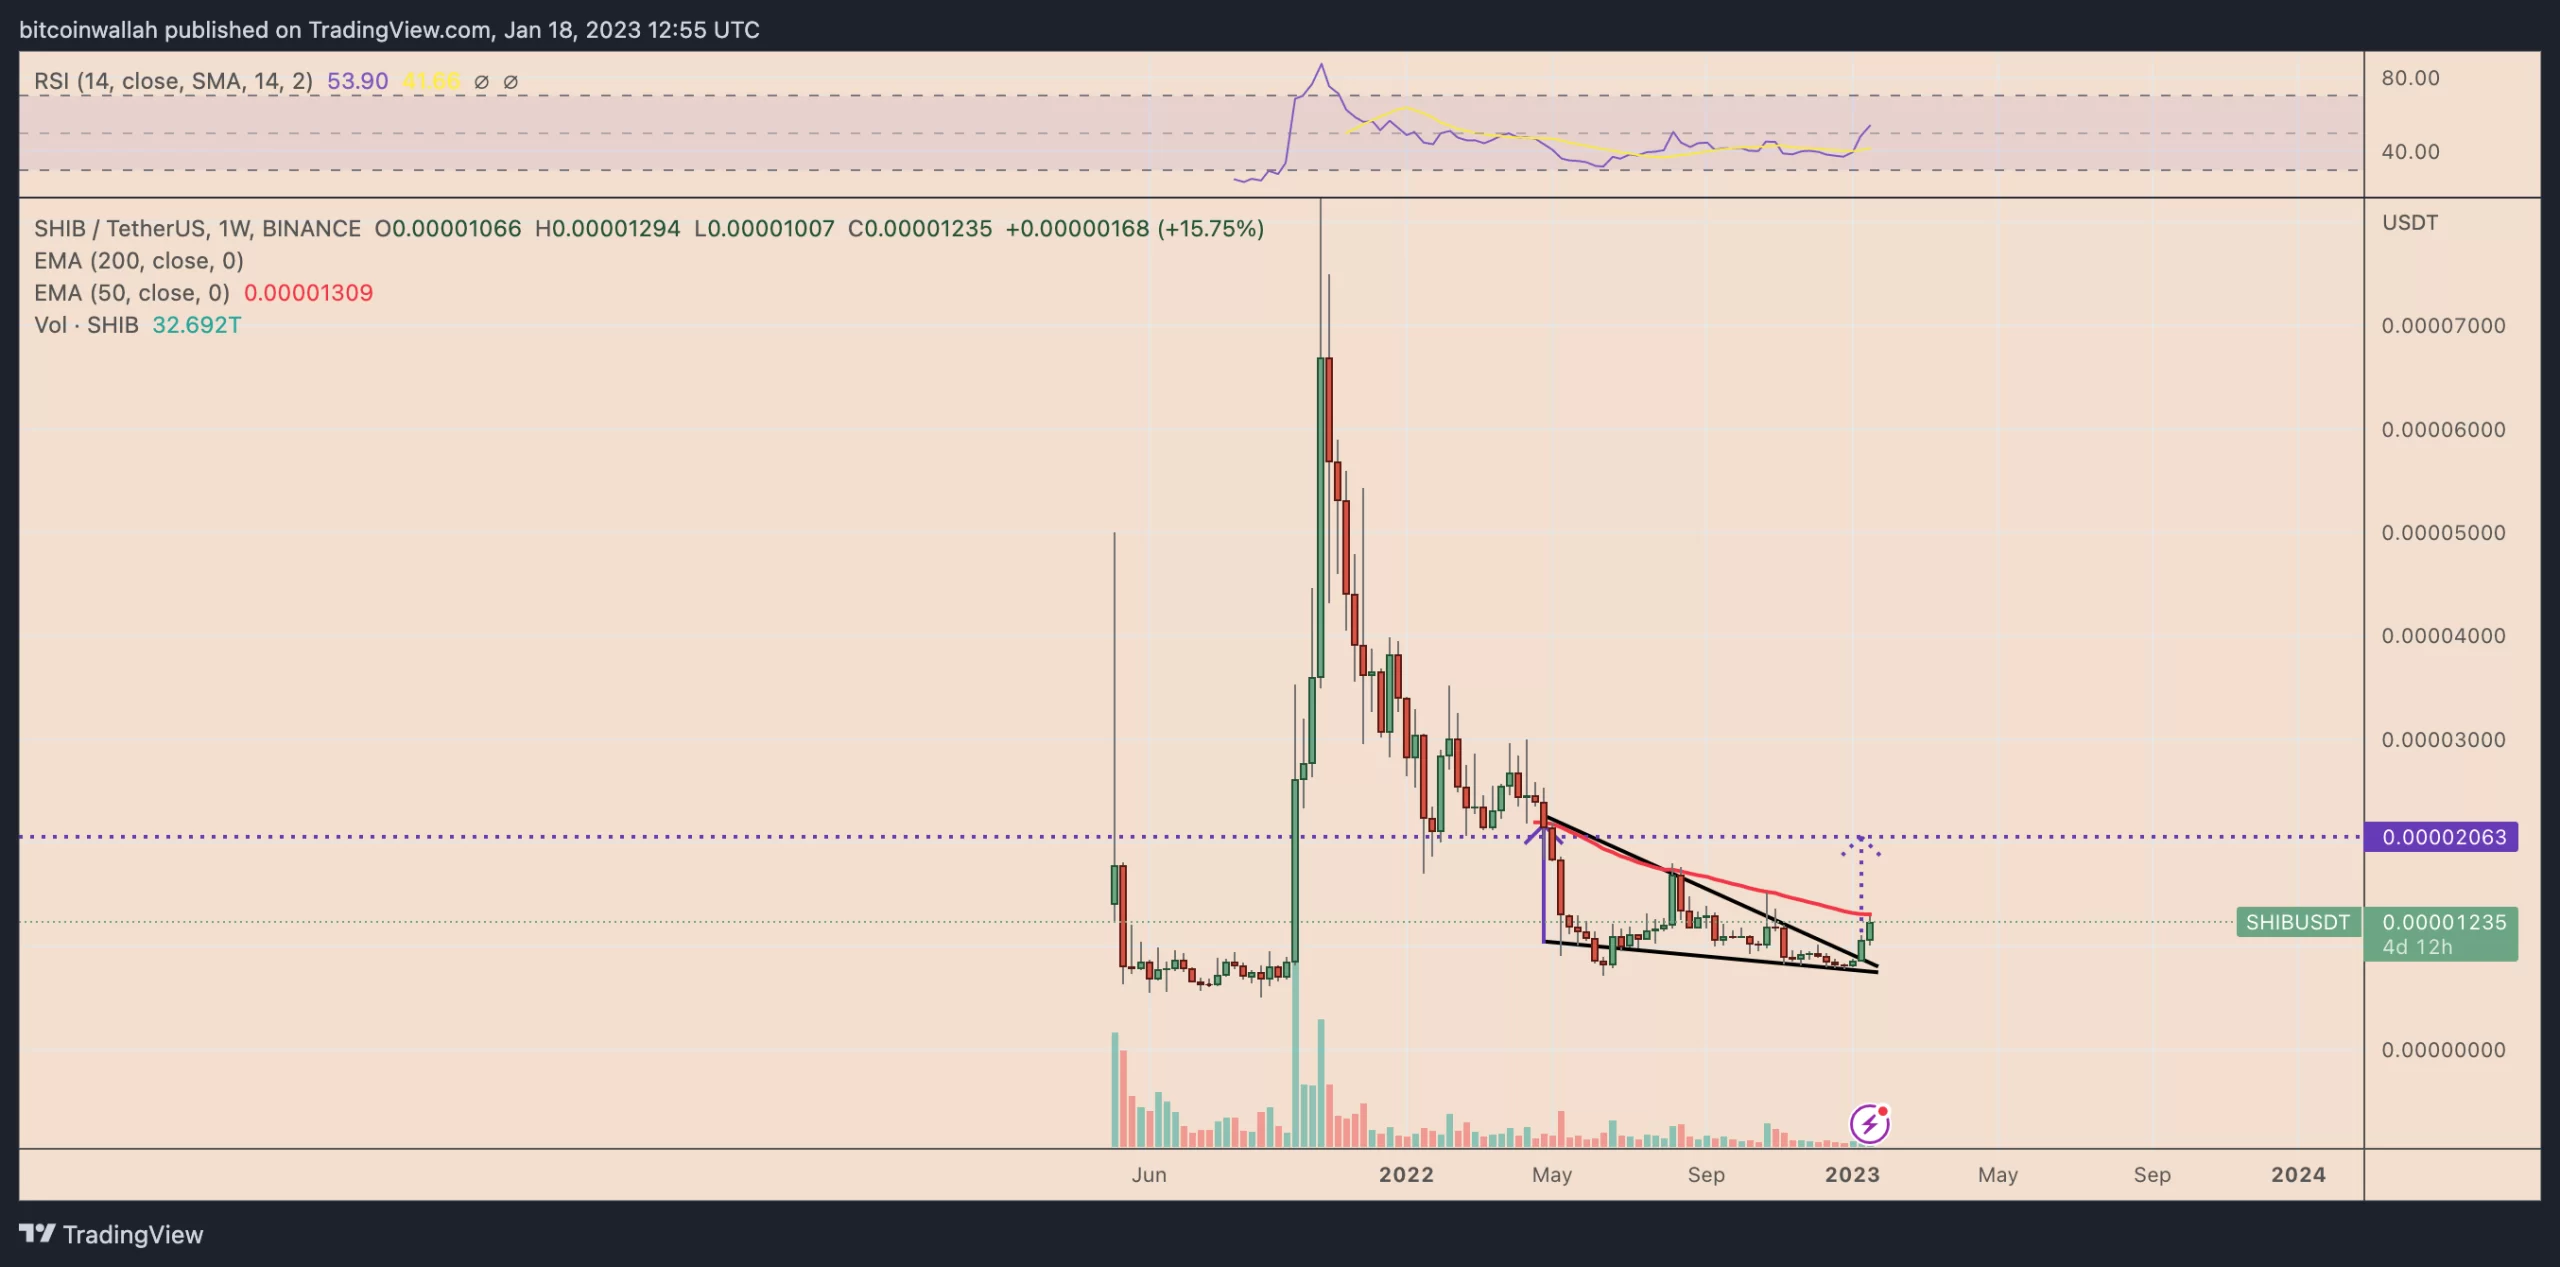
Alternatively, a potentially bearish scenario would see SHIB falling short of the wedge breakout target if the price reverses from its interim resistance level at the 50-week EMA (the red wave) near $0.00001309.
Such a downturn would risk sending the Shiba Inu price toward the wedge’s upper trendline near $0.00000800, or down 40% from current price levels.